本来是想做CNV分析的。然后得到了一个样本的表达矩阵之类的东西,需要按需求画个图,直接用ggplot2了。
library(ggplot2)
导入数据还有挑出需要的样本
data <- read.csv("xxx.txt", header=TRUE, sep="\t")
use_data <- data[, c(1,2)]
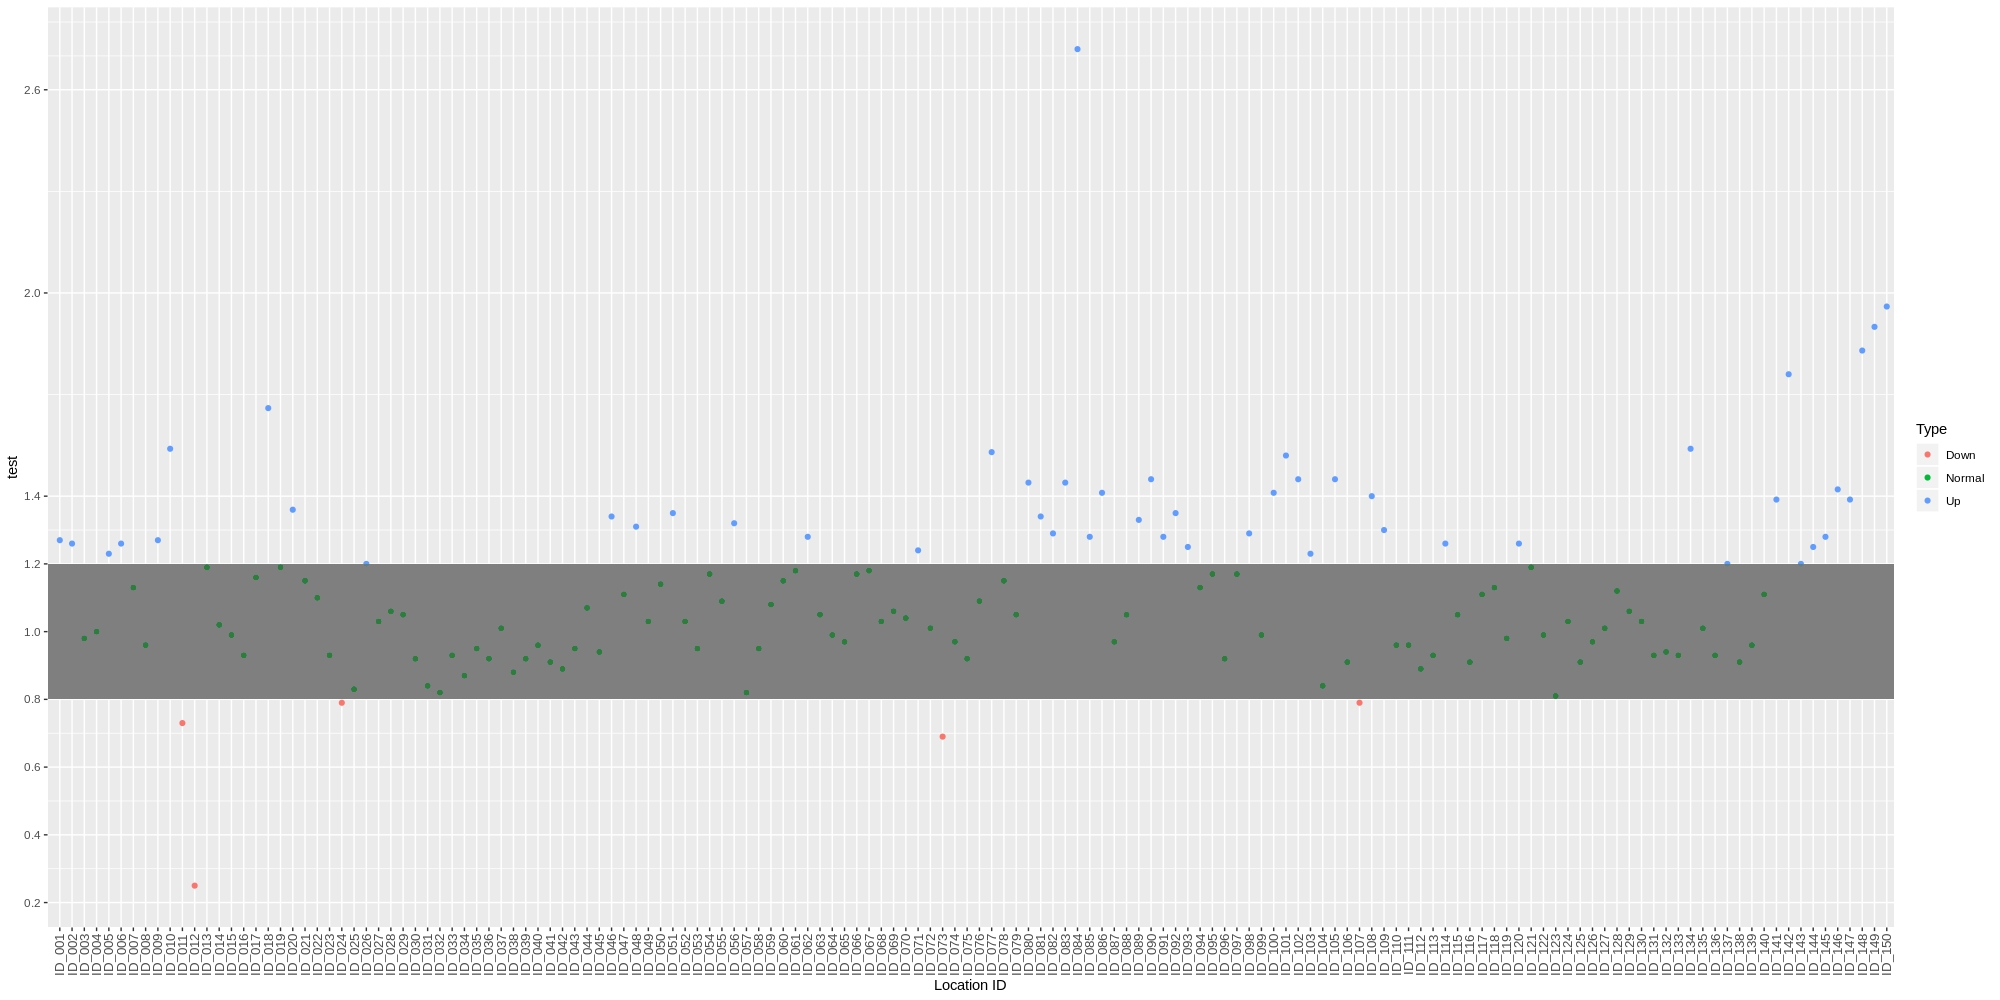
设定一下颜色,因为参考范围是Z检验的[-3, 3]
colors <- ifelse(use_data$sampleID>=3.0, "Up", ifelse(use_data$sampleID<=-3.0, "Down", "Normal"))
use_data$Type <- colors
最后直接出图,这个图不是用下面这个代码画的,但是原理是一样的。
jpeg(file="sampleID", width=2000, height=1000)
p <- ggplot(use_data, aes(x=X, y=sampleID, color=Type)) + geom_point()

cols <- c("Up"="blue", "Normal"="green", "Down"="red")
p + theme(axis.text.x=element_text(size=10, vjust=0.5, hjust=0.5, angle=90)) +
	labs(x="Location ID") +
	scale_y_continuous(breaks=c(-5.0, -4.5, -4.0, -3.5, -3.0, 3.0, 3.5, 4.0, 4.5, 5.0)) +
	geom_rect(mapping=aes(ymin=-3.0, ymax=3.0, xmin=0, xmax=Inf), alpha=0.01, color=NA) +
	scale_colour_manual(values=cols)
dev.off()