关于ROC与AUC曲线,这篇文章写的比较详细,看完基本有个大致的了解了。
这里写一写sklearn画这个曲线。
from sklearn.ensemble import RandomForestClassifier
from sklearn.metrics import roc_curve, auc
import pandas as pd
import matplotlib.pyplot as plt
# 导入训练组测试组
train = pd.read_table("train.txt", sep="\t", header=0, index_col=False)
test = pd.read_table("test.txt", sep="\t", header=0, index_col=False)
xtrain = train.iloc[:, 1:]
ytrain = train["Class"]
xtest = test.iloc[:, 1:]
ytest = train["Class"]
# 模型
clf = RandomForestClassifier()
clf = clf.fit(xtrain, ytrain)
# 画ROC
predict_test = clf.predict(xtest)
prob_test = clf.predict_proba(xtest)
predict_test_value = prob_test[:, 1]
fpr, tpr, thresholds = roc_curve(ytest, predict_test_value)
roc_auc = auc(fpr, tpr)
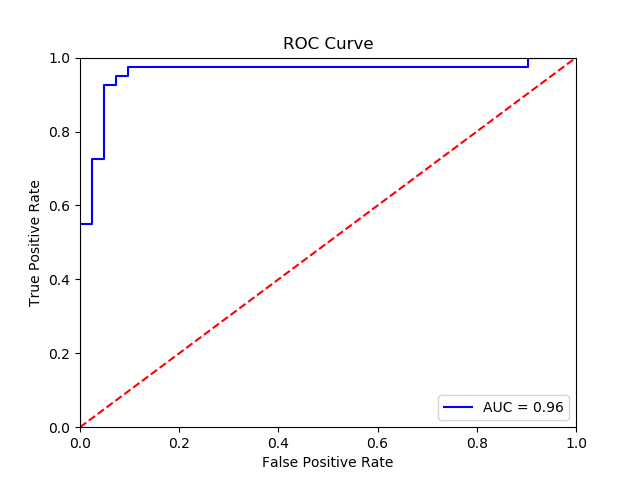
plt.title("ROC Curve")
plt.plot(fpr, tpr, "b", label="AUC = %0.2f" % roc_auc)
plt.legend(loc="lower right")
plt.plot([0, 1], [0, 1], "r--")
plt.xlim([0, 1])
plt.ylim([0, 1])
plt.ylabel("True Positive Rate")
plt.xlabel("False Positive Rate")
plt.show()
画出来是这样的
顺便,还有每个feature的重要性输出的方法:
# 除了上面那些,还需要导入numpy
import numpy as np

def feature_ranking(xtrain, clf):
	importances = clf.feature_importances_
	std = np.std([tree.feature_importances_ for tree in clf.estimators_], axis=0)
	indices = np.argsort(importances)[::-1]
	print("Feature ranking:")
	for f in range(xtrain.shape[1]):
		print("%d. feature %d (%f)" % (f + 1, indices[f], importances[indices[f]]))

	plt.figure()
	plt.title("Feature importances")
	plt.bar(range(xtrain.shape[1]), importances[indices],
		color="r", yerr=std[indices], align="center")
	plt.xticks(range(xtrain.shape[1]), indices)
	plt.xlim([-1, xtrain.shape[1]])
	plt.show()
参考: